


Statistical Tables Plus 5.3
Deskripsi Statistical Tables Plus 5.3
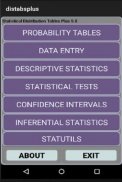
Statistical Tables Plus Version 5.2
Value packed combination of Probability
Distribution Tables, plus commonly used
statistical inference tests.
Updated UI. Inference Test Formulas
added for one and two population means.
Convenient, Accurate, Easy to Read
electronic Probability Distribution Tables.
Commonly used statistical inference tests.
Confidence Interval calculation.
Normal, Binomial, Poisson, T, F and Chi-Square
Distributions. Also, invNorm and
invT calculations.
Data entry for 10 variables.
Descriptive Statistics. (Added Percentiles,
Skewness and Kurtosis).
Statistical Tests Including t-test, ANOVA,
MannWhitneyU Test, Chi-Square Test,
Simple Linear Regression.
Contains calculators for Confidence
Intervals (Sigma Known, Sigma Unknown,
Proportion), Permutations and Combinations.
Great for Intro Probability Statistics
courses, or if you just need these tables!
For both Phone and 10' tablets.
These tables give you the probabilities
associated with your test statistics and
parameters.
To use these tables, just select the
distribution you want, and put in the
test statistic and parameters, and the
APP tells you the related probability.
*************************************
1) For the Normal Distribution:
Enter your Z Score, and you get
the left, right tails and the range.
2) For the Binomial Distribution:
Enter n - number of trials,
p - probability of success,
x - number of successes
and you get the probability of
x, or the cumulative probability
for x.
3) For the Poisson Distribution:
Enter the mean, and number of
occurences, and you will get
the Probability of the number
of occurences, and the cumulative
probability.
4) For the t Distribution:
Enter t and the Degrees of Freedom
and you will get the probability
of the left and right tails, and
the two tailed probability.
5) For the f Distribution:
Enter the f statistic, and the
Degrees of Freedom for the numerator
and denominator. You will get the
probability for the right tail
(alpha for the ANOVA test).
6) For the Chi-Square Distribution:
Enter Chi-Square and the Degrees of Freedom
and you will get the probability
of the right tail.
7) Inverse Normal.
Enter the probability of the
Normal Distribution left tail,
and you get the Z statistic.
8) Inverse t
Enter the probability of the
t distribution left tail, along with
the degrees of freedom, and you will
get the t statistic.
Confidence Intervals:
Sigma Known. Uses the standard
CI formula (Using Z) to determine the range with
CI% chance of containing the true mean
of the population.
Sigma unKnown. Uses the standard
CI formula (Using t) to determine the range with
CI% chance of containing the true mean
of the population.
CI for a proportion. Uses the standard
CI formula (Using p,n,Z) to determine the range with
CI% chance of containing the true mean
of the population.
Statistical Utilities:
Permutations and Combinations give number
of ways to select n Items out of N Items.
In Permutations Order of selected Items matters,
in Combinations it does not. Sampling is
without replacement.
Sample size n, is number needed for CI with
following parameters:
alpha - CI between 0 and 1.0
sigma - Known standard deviation.
E - desired error.
Formula is: n = (Z^2 * s^2) / E^2
Z is Z score for (1-alpha)/2
Includes 5 common statistical tests,
and Descriptive Statistics.
Help for each test is included in
the APP.
Inferential Statistics Formulas:
Difference between 2 Population Means.
Hypothesis Test Mean.
Proportions.
Free!. Please visit this APP in
the Google Play store to Rate and
enter comments. This will help us
improve the APP over time.
Due care has been taken for accurate results.
This APP is for educational use.
However, no warrenty against any damages due to
use is included or implied.
Tabel Statistik Plus Versi 5.2
Kombinasi nilai Probability yang dikemas
Tabel Distribusi, plus yang biasa digunakan
uji inferensi statistik.
UI yang diperbarui. Rumus Uji Inferensi
ditambahkan untuk satu dan dua berarti populasi.
Nyaman, Akurat, Mudah Dibaca
Tabel Distribusi Probabilitas elektronik.
Tes inferensi statistik yang umum digunakan.
Perhitungan Interval Keyakinan.
Normal, Binomial, Poisson, T, F dan Chi-Square
Distribusi. Juga, invNorm dan
perhitungan invT.
Entri data untuk 10 variabel.
Statistik deskriptif. (Menambahkan Persentil,
Skewness and Kurtosis).
Tes Statistik Termasuk t-test, ANOVA,
Uji MannWhitneyU, Uji Chi-Square,
Regresi Linier Sederhana.
Berisi kalkulator untuk Keyakinan
Interval (Sigma Dikenal, Sigma Tidak Diketahui,
Proporsi), Permutasi dan Kombinasi.
Besar untuk Intro Probability Statistics
kursus, atau jika Anda hanya perlu tabel ini!
Untuk tablet Ponsel dan 10 '.
Tabel ini memberi Anda probabilitas
terkait dengan statistik pengujian Anda dan
parameter.
Untuk menggunakan tabel ini, cukup pilih
distribusi yang Anda inginkan, dan masukkan
uji statistik dan parameter, dan
APP memberi tahu Anda probabilitas terkait.
*************************************
1) Untuk Distribusi Normal:
Masukkan Skor Z Anda, dan Anda dapatkan
ekor kiri, kanan dan jangkauan.
2) Untuk Distribusi Binomial:
Masukkan n - jumlah uji coba,
p - probabilitas keberhasilan,
x - jumlah keberhasilan
dan Anda mendapatkan probabilitas
x, atau probabilitas kumulatif
untuk x.
3) Untuk Distribusi Poisson:
Masukkan mean, dan jumlah
kejadian, dan Anda akan mendapatkan
Probabilitas angka tersebut
kejadian, dan kumulatif
kemungkinan.
4) Untuk Distribusi t:
Masukkan t dan Derajat Kebebasan
dan Anda akan mendapatkan probabilitas
ekor kiri dan kanan, dan
probabilitas dua sisi.
5) Untuk Distribusi f:
Masukkan statistik f, dan
Derajat Kebebasan untuk pembilang
dan penyebut. Anda akan mendapatkan
probabilitas untuk ekor yang tepat
(alpha untuk tes ANOVA).
6) Untuk Distribusi Chi-Square:
Masukkan Chi-Square dan Derajat Kebebasan
dan Anda akan mendapatkan probabilitas
dari ekor kanan.
7) Berbalik Normal.
Masukkan probabilitas
Distribusi kiri ekor normal,
dan Anda mendapatkan statistik Z.
8) Membalikkan t
Masukkan probabilitas
t distribusi ekor kiri, bersama dengan
derajat kebebasan, dan Anda akan melakukannya
dapatkan statistik t.
Interval Keyakinan:
Sigma Diketahui. Menggunakan standar
Rumus CI (Menggunakan Z) untuk menentukan rentang dengan
CI% kemungkinan mengandung mean sebenarnya
dari populasi.
Sigma tidak dikenal. Menggunakan standar
Rumus CI (Menggunakan t) untuk menentukan rentang dengan
CI% kemungkinan mengandung mean sebenarnya
dari populasi.
CI untuk proporsi. Menggunakan standar
Rumus CI (Menggunakan p, n, Z) untuk menentukan rentang dengan
CI% kemungkinan mengandung mean sebenarnya
dari populasi.
Utilitas Statistik:
Permutasi dan Kombinasi memberikan nomor
cara untuk memilih n Item dari N Item.
Dalam Permutasi Urutan item yang dipilih penting,
dalam Kombinasi tidak. Pengambilan sampel adalah
tanpa penggantian.
Ukuran sampel n, adalah jumlah yang dibutuhkan untuk CI dengan
parameter berikut:
alpha - CI antara 0 dan 1.0
sigma - Deviasi standar yang dikenal.
Kesalahan yang diinginkan.
Rumusnya adalah: n = (Z ^ 2 * s ^ 2) / E ^ 2
Z adalah skor Z untuk (1-alpha) / 2
Termasuk 5 tes statistik umum,
dan Statistik Deskriptif.
Bantuan untuk setiap tes termasuk dalam
aplikasi.
Rumus Statistik Inferensial:
Perbedaan antara 2 Populasi Berarti.
Mean Uji Hipotesis.
Proporsi.
Gratis!. Kunjungi APP ini di
Google Play store untuk Menilai dan
masukkan komentar. Ini akan membantu kita
meningkatkan aplikasi dari waktu ke waktu.
Kehati-hatian telah diambil untuk hasil yang akurat.
Aplikasi ini untuk penggunaan pendidikan.
Namun, tidak ada warrenty terhadap kerusakan yang disebabkan oleh
penggunaan disertakan atau tersirat.
Statistical Tables Plus 5.3 - Versi 5.7
(09-06-2023)Statistical Tables Plus 5.3 - Informasi APK
Versi APK: 5.7Paket: com.marcusacademy.stattabsplusVersi Terakhir dari Statistical Tables Plus 5.3
Versi lain


 4.33
4.33 3.55
3.55


Aplikasi pada kategori yang sama


Anda juga mungkin suka...
Aplikasi pada kategori yang sama


